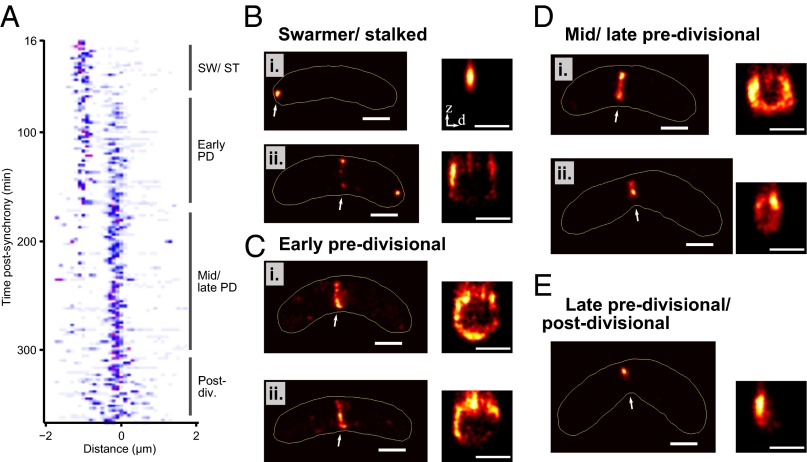
Fig. 2.
The 3D structure of the Z-ring throughout the C. crescentus cell cycle. (A) FtsZ axial localization relative to cell center as a function of time for 275 cells. Color map ranges from white (lowest density) to blue and then red (highest density). (B–E) Representative PALM images of FtsZ localization throughout the cell cycle, in xy (Left) and in zd cross-section (Right), where d is lateral distance from cell midplane in transformed xy coordinates, which removes the effect of cell curvature. Arrow indicates region shown in z cross-section. Yellow line indicates automatically determined cell outline. Corresponding phase-contrast images are shown in SI Appendix, Fig. S3A. (Scale bars, 500 nm.)

