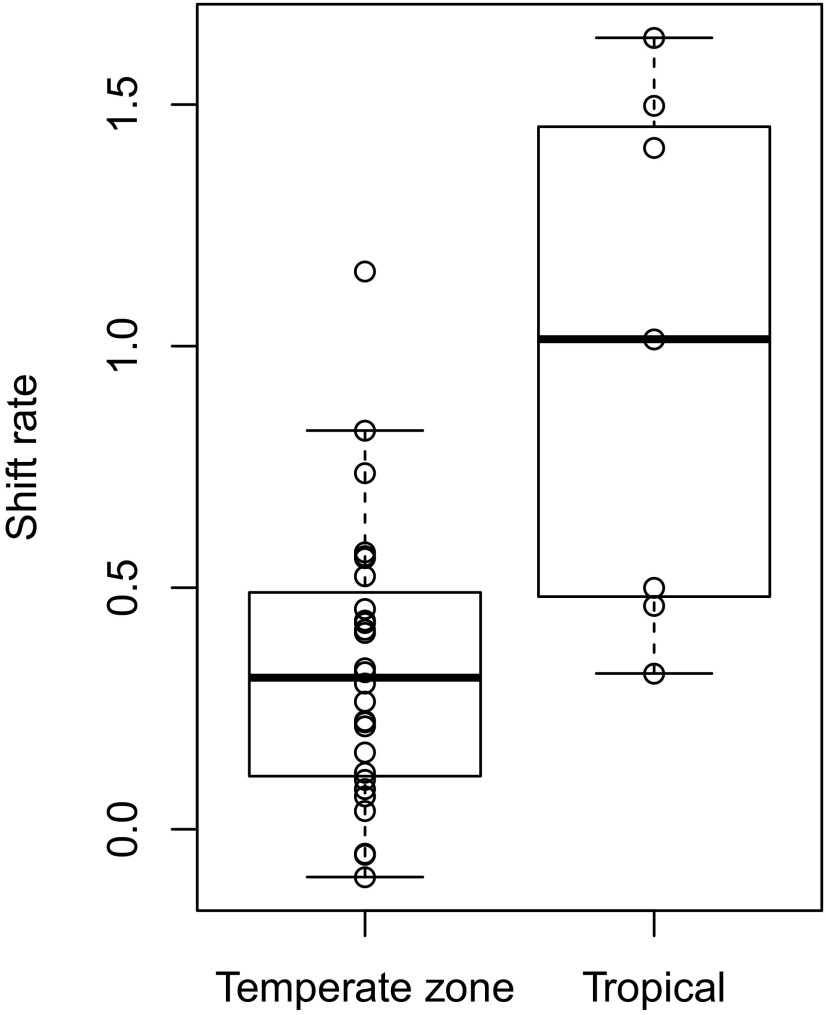
Fig. 3.
Shift rates of temperate-zone and tropical montane organisms in resurveys documenting distributional responses to temperature increases. Shift rates represent the average upslope shift (m) documented in a resurvey compared with the predicted upslope shift (m) given local temperature increase. A shift rate of 1 signifies observed shifts that match predicted shifts. Boxplots with median and quartile values for temperate-zone and tropical shift rates are overlain on points summarizing shift rates of temperate-zone (n = 28) and tropical (n = 7) resurveys of a variety of taxonomic groups (Table S3).

