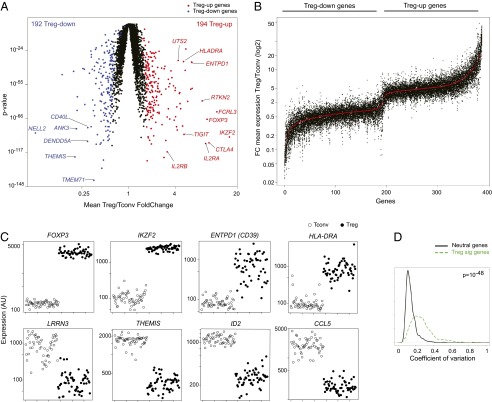
Fig. 1.
Interindividual variability in Treg signature transcripts. (A) Gene-expression profiles were generated from purified Treg and Tconv cells from blood of 168 individuals, and the average expression values are compared. (B) Treg signature transcripts are ranked according to mean differential expression (red dots), and the Treg/Tconv ratio for each individual of Cohort3 is plotted. (C) Normalized microarray expression levels in Tconv and Treg cells of selected genes (on a linear scale from 20 to 20,000, where 120 represents a 95% probability of expression); each dot represents 1 of 55 donors from cohort 3. (D) Histogram of gene-wise coefficient of variation across the datasets for Treg signature genes or for a random expression-matched set of genes (P value, Wilcoxon rank-sum test).

