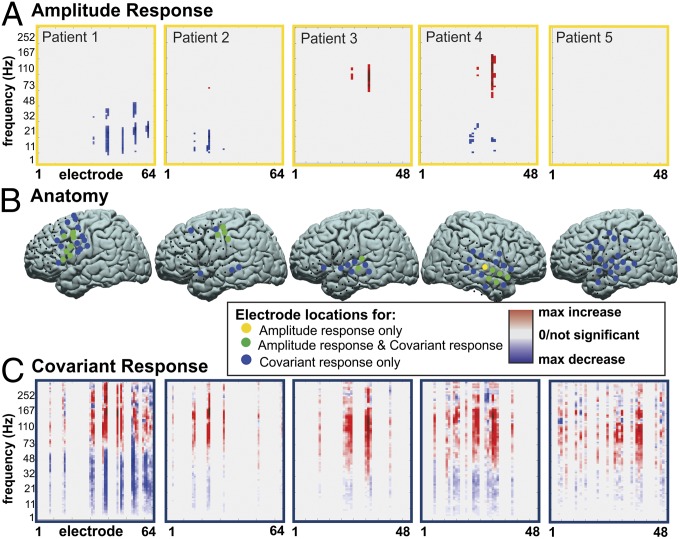
Fig. 1.
Amplitude response vs. covariant amplitude response for any spoken word vs. rest for subjects 1–5 (rows 1–5, respectively) at the time period containing the voice onset time. (A) Thresholded (P < 0.05) electrode vs. frequency signed r2 values (with red indicating a positive and blue a negative r2 value). (B) Locations of the electrodes with at least one frequency bin with a significant r2 value in amplitude response (yellow circles), the electrodes included in the FSN (blue circles), or both (green circles). (C) The right column shows FSN patterns in electrode vs. frequency, with small to large increases and decreases indicated with light to dark red and blue.

