Fig. 2.
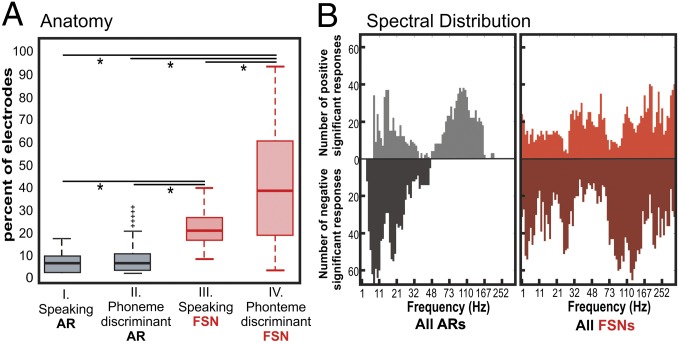
Anatomic and spectral distribution of physiologic response over all subjects and significant time periods. (A) Distribution of the percentages of electrodes with a significant amplitude response (AR) for speaking vs. rest (I.), AR for any phoneme comparison (II.), within a FSN for speaking vs. rest (III.), and FSN for any phoneme comparison (IV.). *P < 0.0001. Boxes represent upper and lower quartile of data; whiskers represent maxima and minima of data. +, outlier data points. (B) Summated pseudospectra for ARs (gray shaded areas; Left) and FSNs (red shaded areas; Right) with significant increases (above zero line) or decreases (below zero line) over all task comparisons. Significant ARs had P < 0.05, and significant FSNs frequency bins had a SE above or below zero for all of the electrodes in a single spectral grouping.

