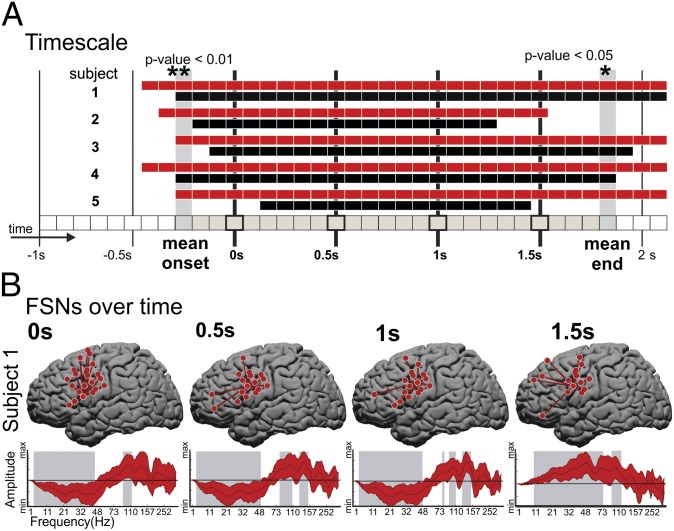
Fig. 3.
Temporal characteristics. (A) Significant speaking vs. rest time periods for subjects 1–5 (top to bottom rows). Time points with a significant AR and/or FSN are indicated by black and red rectangles, respectively. The vertical black lines indicate the time periods that include the –1-, –0.5-, 0-, 0.5-, 1-, 1.5-, and 2-s time samples relative to voice onset time. The mean onset and end times of significance across ARs and FSNs and all subjects are indicated by the gray-shaded vertical columns. (B) The speech vs. rest FSNs for time periods that include the 0-, 0.5-, 1-, and 1.5-s time samples (columns from left to right) for subject 1. Each plot shows the locations on the brain and spectral distributions of the electrodes in the FSNs. The patterns represent amplitude modulations (increases or decreases) that are shared across the electrode group (as shown by the star plots) that are consistent during task when compared against rest. The shaded gray regions indicate spectral ranges with a SE within the spectral group electrode above or below zero.

