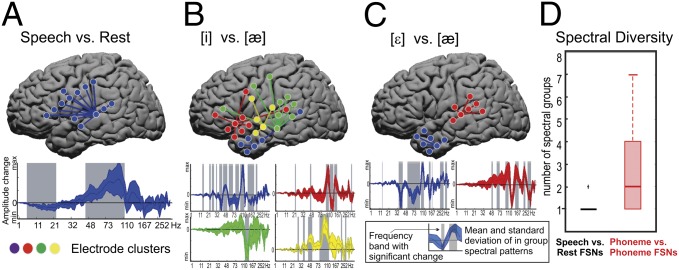
Fig. 4.
FSN spectral diversity. A–C show FSNs for subject 5 and the time period from 250 to 417 ms after voice onset time. (A) Speech vs. rest. The top brain plot shows the locations of the electrodes included in the FSN projected onto a standardize MNI brain surface. The bottom plot shows the mean (dark blue line) and SE range (shaded blue region) of amplitude change across the spectral bins for all electrodes in the FSN. The shaded gray regions indicate spectral ranges with a SE within the spectral group electrode above or below zero. (B) [i] vs. [æ], with blue, red, yellow, and green indicating the four spectral groups within the FSN. (C) [ε] vs. [æ]. (D) Distributions of number of spectral groups in all speech vs. rest (black) and all phoneme-discriminant (red) FSNs. Boxes represent upper and lower quartile of data; whiskers represent maxima and minima of data. +, outlier data points.

