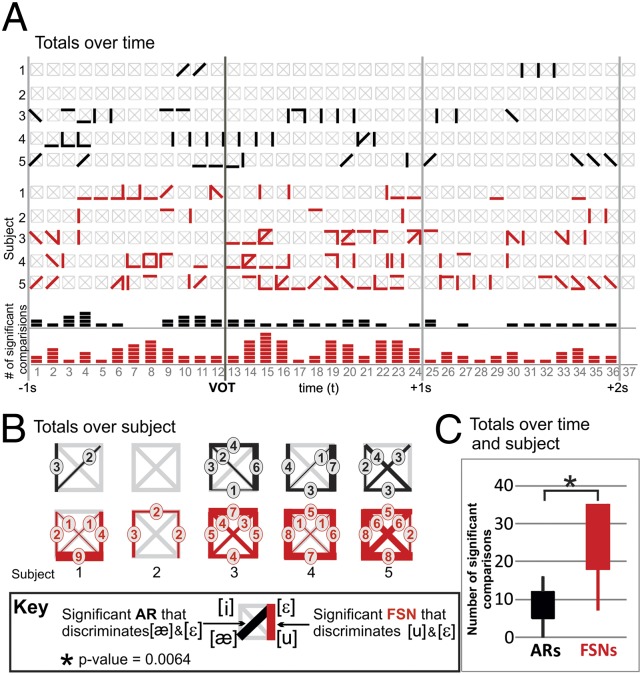
Fig. 5.
Phoneme discrimination for AR vs. FSN. (A) Graph of time periods (horizontal axis) with significant AR (black) and FSN (red) phoneme discrimination. Rows 1–5 and 6–10 correspond to the AR and FSN results, respectively. The grids in rows 1–10 depict the six possible phoneme comparisons as described in the figure key. Rows 11 and 12 correspond to the AR and FSN results summed over subjects and phoneme pairs for each time period. (B) Histograms of AR (top row) and FSN (bottom row) phoneme pair discrimination for subjects 1–5. Each plot indicates the number of significant time periods between each for the six phoneme comparisons, with no significant time periods marked with a gray line. (C) Distributions of the number of significant time periods for ARs and FSNs summed over subjects. VOT, voice onset time.

