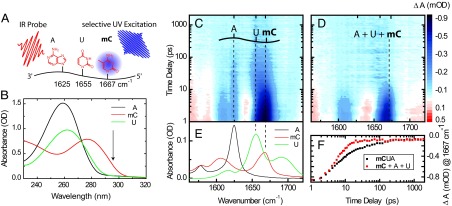
Fig. 1.

Selective excitation of mC in mCUA and probing of characteristic A, U, and mC marker bands in the IR. (A, B, and E) Picosecond UV light pulses at 295 nm allow selective excitation of mC (shown in bold) in mixed DNA sequences consisting of mC, U, and A. (B) Absorbance spectra of 2′-deoxyadenosine monophosphate (A), 2′-deoxy-5-methylcytidine (mC), and uridine monophosphate (U). (C) Time-resolved absorption difference (color-coded) plotted vs. wavenumber and delay time for mCUA and (D) for a mixture of the corresponding monomers. (E) Probing the individual contribution of each base is possible in the IR at 1,625 cm−1 (A), 1,655 cm−1 (U), and 1,667 cm−1 (mC) (marked by dashed lines). (F) Transients at 1,667 cm−1 for mCUA and the mixture of monomers.
