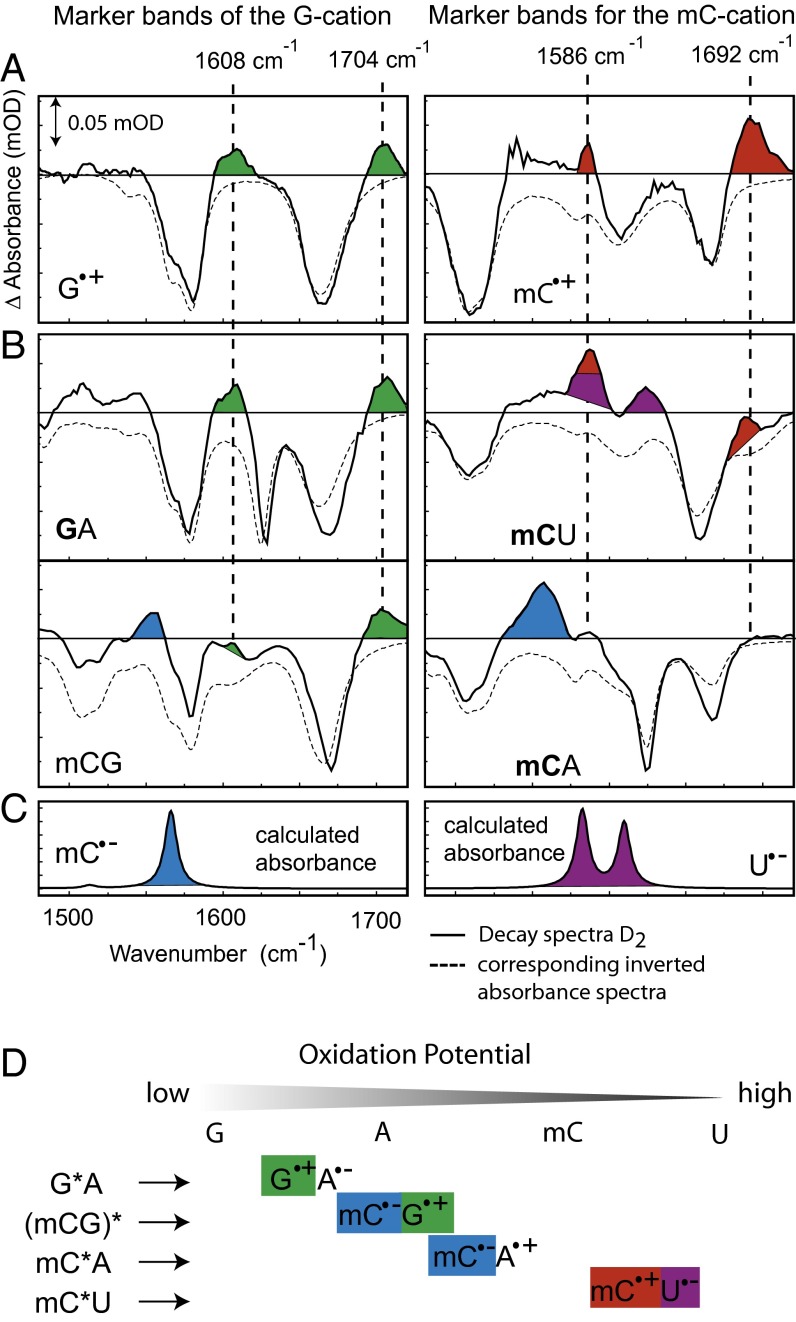
Fig. 3.
Identification of cation and anion marker bands in the decay spectra of different dinucleotides. (A) Two-photon ionization of G and mC yields the difference spectra of G/G∙+ and mC/mC∙+ with the characteristic positive marker bands at 1,608 cm−1, 1,704 cm−1 and 1,586 cm−1, 1,692 cm−1 for the radical cationic form. The corresponding inverted absorption spectra of the dinucleotides are overlaid (dashed lines). (B) Decay spectra D2(ν) of GA, mCG, mCU, and mCA [selectively excited base in bold (295 nm), mCG was unselectively excited at 266 nm]. The marker bands are highlighted in color. The position of cation marker bands in the decay spectra is marked by dashed lines. (C) mC∙− and U∙− absorption spectra calculated with density functional theory. (D) Oxidation potential of G, A, mC, and U and resulting charge-transfer states of the different dimeric samples. The species assigned in the decay spectra are highlighted by the appropriate color.

