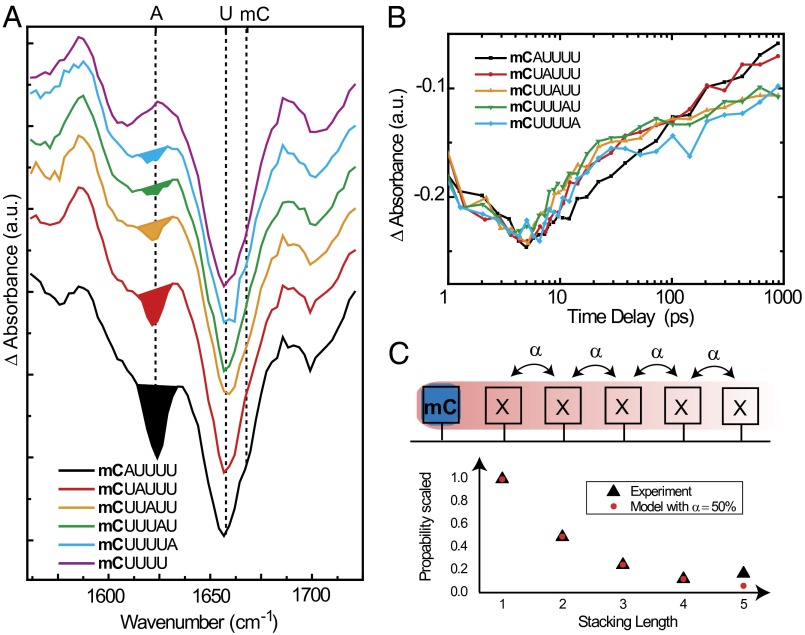
Fig. 4.
Distance dependency of the A bleach in mCUaAU(4 − a) oligonucleotides. (A) Normalized decay spectra D2(ν) of the oligomers mCUaAU(4-a), (a = 0–4). mC is selectively excited at 295 nm in all cases. Bleach of ground-state absorbance band of A at 1,625 cm−1 is highlighted by the colored area. A, mC, and U absorbance bands are marked with dashed lines. (B) Scaled transient absorbance at 1,625 cm−1 for the mCUaAU(4 − a) oligonucleotides. (C) Simple stacking model. The stacking-length probability can be calculated by assuming a noncooperative stacking probability α of 50% (red dots), which reproduces well the experimental bleach signal of A (integrated bleach signal, black triangles).

