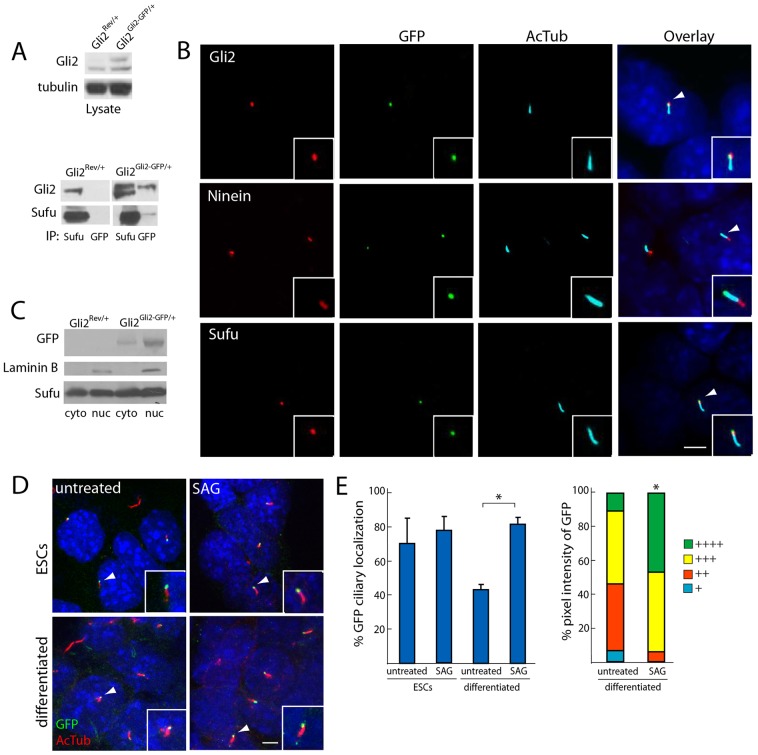
Fig. 1.
Gli2–GFP recapitulates wild-type Gli2 localization and ciliary dynamics. (A) Whole-cell lysates from Gli2Rev/+ and Gli2Gli2–GFP/+ ESCs were probed with an anti-Gli2 antibody. Gli2–GFP was expressed at equivalent levels to wild-type Gli2. The lysate was also immunoprecipitated with either anti-GFP or anti-Sufu, and was immunoblotted for Gli2 and Sufu. Sufu co-immunoprecipitates Gli2 in Gli2Rev/+ ESC lysate and co-immunoprecipitates both Gli2–GFP and Gli2 in Gli2Gli2–GFP/+ ESC lysate. Anti-GFP antibody immunoprecipitates both Gli2–GFP and Sufu only from Gli2Gli2–GFP/+ ESC lysate. (B) Gli2–GFP localizes to the ciliary tip of Gli2Gli2–GFP/+ ESCs. GFP localizes to the opposite end of cilia (as identified by anti-acetylated tubulin, AcTub) compared to the basal body marker Ninein, and exhibits co-localization with the ciliary tip protein Sufu. Insets, the individual cilium indicated by the white arrowhead. Scale bar: 5 µm. (C) Gli2Rev/+ and Gli2Gli2–GFP/+ ESC lysates were separated into nuclear and cytoplasmic fractions and probed for GFP, Sufu and Laminin B, a component of the nuclear envelope. GFP and Sufu were detected in both the nuclear and cytoplasmic fractions, whereas Laminin B was only detected in the nuclear fraction. (D) Following treatment with DMSO or SAG (1 µM for 1 hour), Gli2Rev/+ and Gli2Gli2–GFP/+ ESCs were stained for GFP and AcTub. Ciliary localization of Gli2–GFP was detected in both undifferentiated and differentiated cells, and in untreated and SAG-treated cells (insets, the individual cilium indicated by the white arrowhead). Scale bar: 5 µm. (E) Undifferentiated and differentiated Gli2Gli2–GFP/+ ESCs were quantified for the number of cilia exhibiting GFP localization (three independent experiments, n = 100 per condition) and ciliary GFP pixel intensity (see Materials and Methods, and Wen et al., 2010; three independent experiments, n = 40 per condition). + denotes lowest pixel intensity, whereas ++++ denotes highest pixel intensity. SAG treatment of differentiated cells increased both the proportion of cilia with localization of Gli2–GFP (left, *P<0.05, Student's t-test) and the intensity of ciliary Gli2–GFP (right, *P<0.05, Chi-squared test). Error bars represent s.d. throughout.

