Fig. 4.
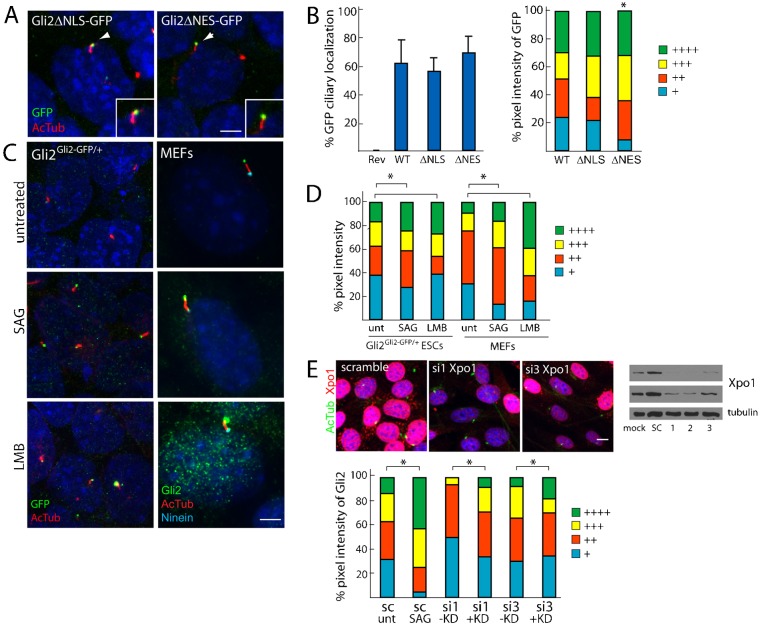
Nuclear import signals do not mediate ciliary localization of Gli2 but nuclear export signals might play a role in Gli2 ciliary exit. (A) Gli2Gli2ΔNLS–GFP/+ and Gli2Gli2ΔNES–GFP/+ ESCs were stained for cilia (AcTub, red) and GFP (insets show the individual cilium indicated by white arrowheads). Scale bar: 5 µm. (B) The ciliary localization prevalence and pixel intensity of Gli2ΔNLS–GFP (ΔNLS) and Gli2ΔNES–GFP (ΔNES) were compared to those of Gli2–GFP (WT). + denotes lowest pixel intensity, whereas ++++ denotes highest pixel intensity. *P<0.05 (Chi-squared test, as compared to WT). (C) Gli2Gli2–GFP/+ ESCs and MEFs were treated with DMSO, SAG (1 µM, 1 hour) and Leptomycin B (LMB, 20 nM, 90 minutes), an inhibitor of Exportin1 (Xpo1). Cells were stained for cilia (AcTub), GFP or Gli2 (to mark Gli2–GFP in ESCs and Gli2 in MEFs) and Ninein (to mark the basal body). (D) Quantification of panel C where the pixel intensities for GFP and Gli2 are assessed for differentiated Gli2Gli2–GFP/+ ESCs and MEFs, respectively. *P<0.05 (Chi-squared test). (E) NIH3T3 fibroblasts were transfected for 72 hours with siRNA against Exportin1 (si1,2,3) or a scramble control (sc), and were stained for cilia (AcTub, green) and Xpo1 (red). Scale bar: 10 µm. The knockdown efficiency was also assessed by an Xpo1 and tubulin immunoblot of the total cell lysate (top panel, 5-second exposure; middle panel, 30-second exposure). Ciliary Gli2 pixel intensity was assessed in cells showing diminished Xpo1 immunofluorescence (+KD) and normal Xpo1 levels (−KD) (three independent experiments, n = 50 per condition). *P<0.05 (Chi-squared test).

