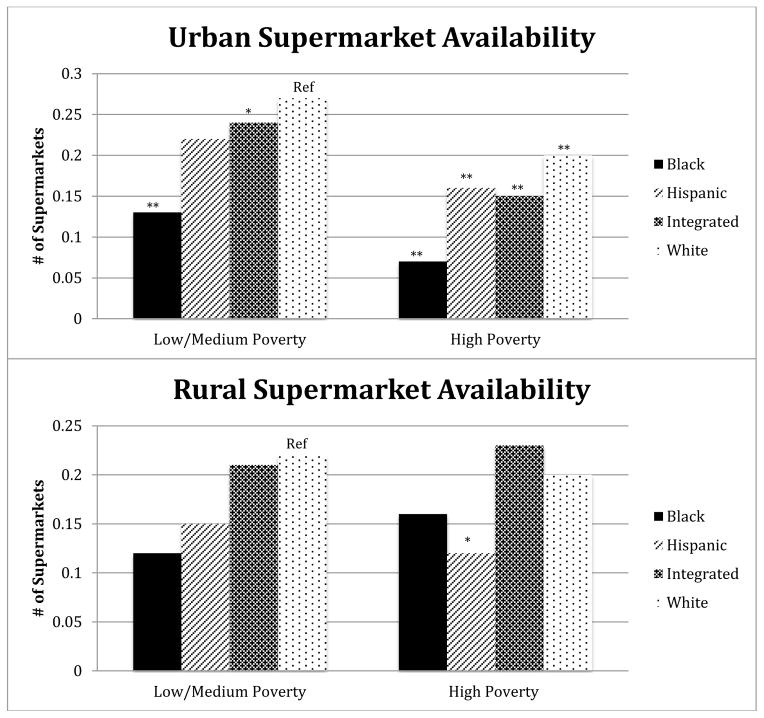
Figure 2.
Count of supermarkets by neighborhood poverty and racial/ethnic composition in rural versus urban samples+
The symbols * and ** represent p≤0.05 and p≤0.001, respectively.
+Estimates are incidence rate ratios (IRRs) derived from negative binomial regression models controlling for region, urbanicity, and population density.

