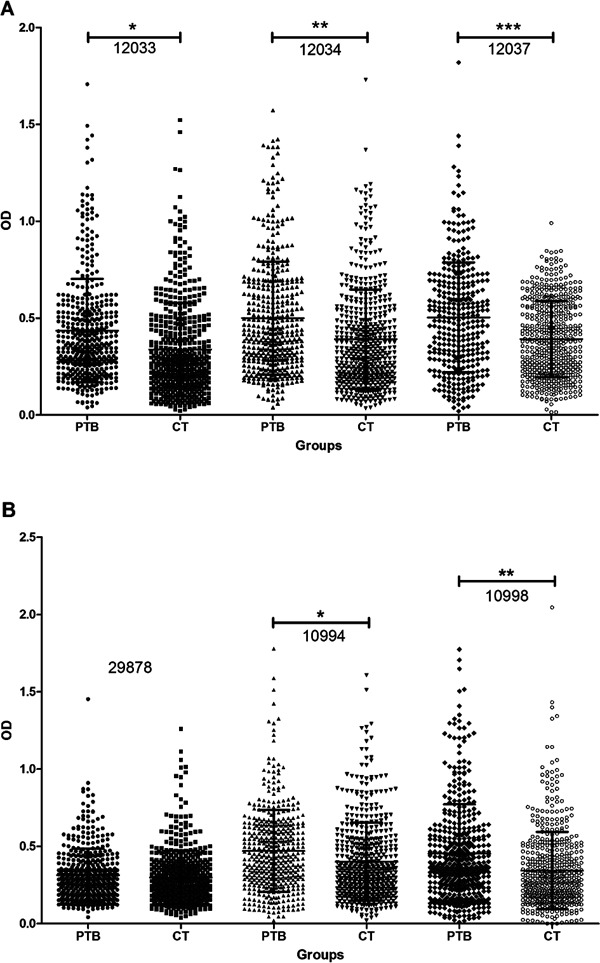
Fig. 1. analysis of receiver operating characteristic and comparison of the optical density (OD) distribution are shown between patient with pulmonary tuberculosis (PTB) and control group (CT) (composed by health control and leprosy groups). A: antibody reactivity to ESAT-6 peptides: 12033 peptide [PTB (●) and CT (■)], cut-off (↔) > 0.113, 12034 peptide [PTB (▲) and CT (▼)], cut-off (↔) > 0.143, 12037 peptide [PTB (♦) and CT (●)], cut-off (↔) > 0.716. *, **, ***: the significance between PTB and CT groups, p ≤ 0.0001; B: antibody reactivity to Ag85A peptides: 28978 peptide [PTB (●) and CT (■)], cut-off (↔) ≤= 0.083, 10994 peptide [PTB (▲) and CT (▼)], cut-off (↔) > 0.401, 10998 peptide [PTB (♦) and CT (●)], cut-off (↔) > 0.261. *, **: the significance between PTB and CT groups, p ≤ 0.0001.

