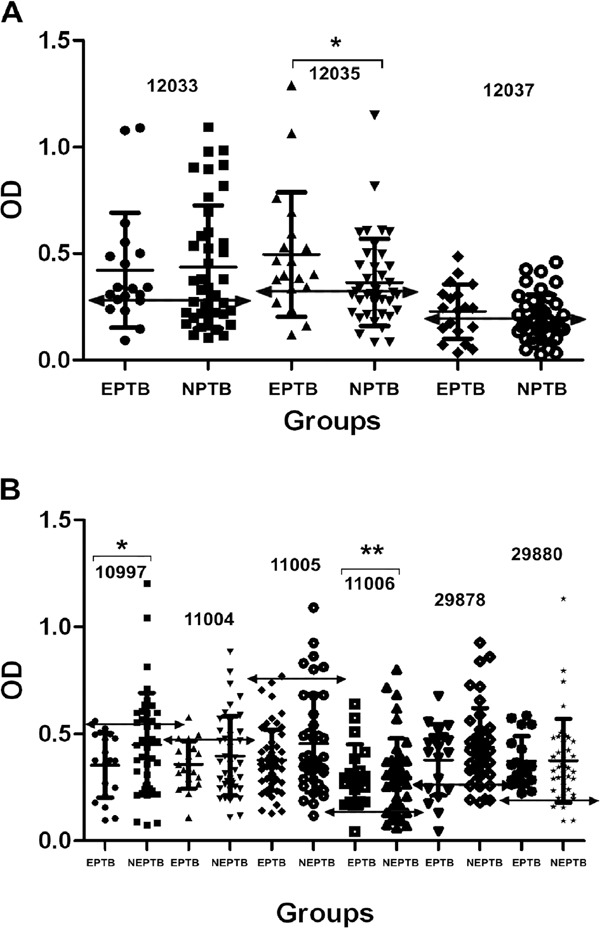
Fig. 2. analysis of receiver operating characteristic and comparison of the optical density (OD) distribution are shown between patients with extrapulmonary tuberculosis (EPTB) and non-EPTB. A: antibody reactivity to ESAT-6 peptides: 12033 peptide [EPTB (●) and NEPTB (■)], cut-off (↔) > 0.276, 12035 peptide [EPTB (▲) and NEPTB (▼)[, cut-off (↔) > 0.331, 12037 peptide [EPTB (♦) and NEPTB (●)[, cut-off (↔) > 0.223. Asterisk means the significance between EPTB and NEPTB groups, p ≤ 0.04; B: antibody reactivity to Ag85A peptides: 10997 peptide [EPTB (●) and NEPTB (■)[, cut-off (↔) ≤= 0.526, 11004 peptide [EPTB (▲) and NEPTB (▼)[, cut-off (↔) ≤= 0.496, 11005 peptide [EPTB (♦) and NEPTB (●)[, cut-off (↔) ≤= 0.741, 11006 peptide [EPTB (■) and NEPTB (▲)[, cut-off (↔) > 0.156, 29878 peptide [EPTB (▼) and NEPTB (♦)[, cut-off (↔) ≤= 0.244, 29880 peptide [EPTB (*) and NEPTB (*)], cut-off (↔) > 0.214. *: the significance between NEPTB and EPTB groups, p ≤ 0.001; **: the significance between EPTB and NEPTB groups, p ≤ 0.002.

