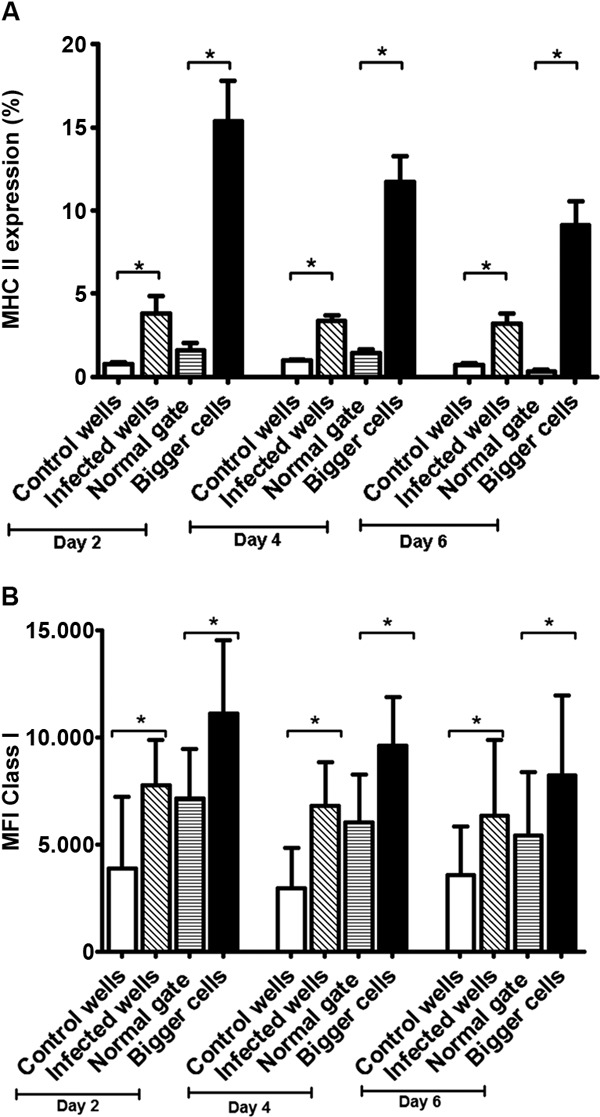
Fig. 4. major histocompatibility complex (MHC) I and II expression on infected astrocytoma cell line. A: mean and standard deviation (SD) of cells expressing MHC II according to the day post-infection (p.i.). Uninfected wells used as negative controls (empty bars), cells from infected wells (oblique lines), normal cells from infected wells (horizontal lines) and presumably infected cells (black bars) from infected wells; B: mean fluorescence intensity (MFI) and SD of MHC I on astrocytes according to the day p.i. Groups were defined as in A. Asterisk means p ≤ 0.05. n = 14, Student t test.

