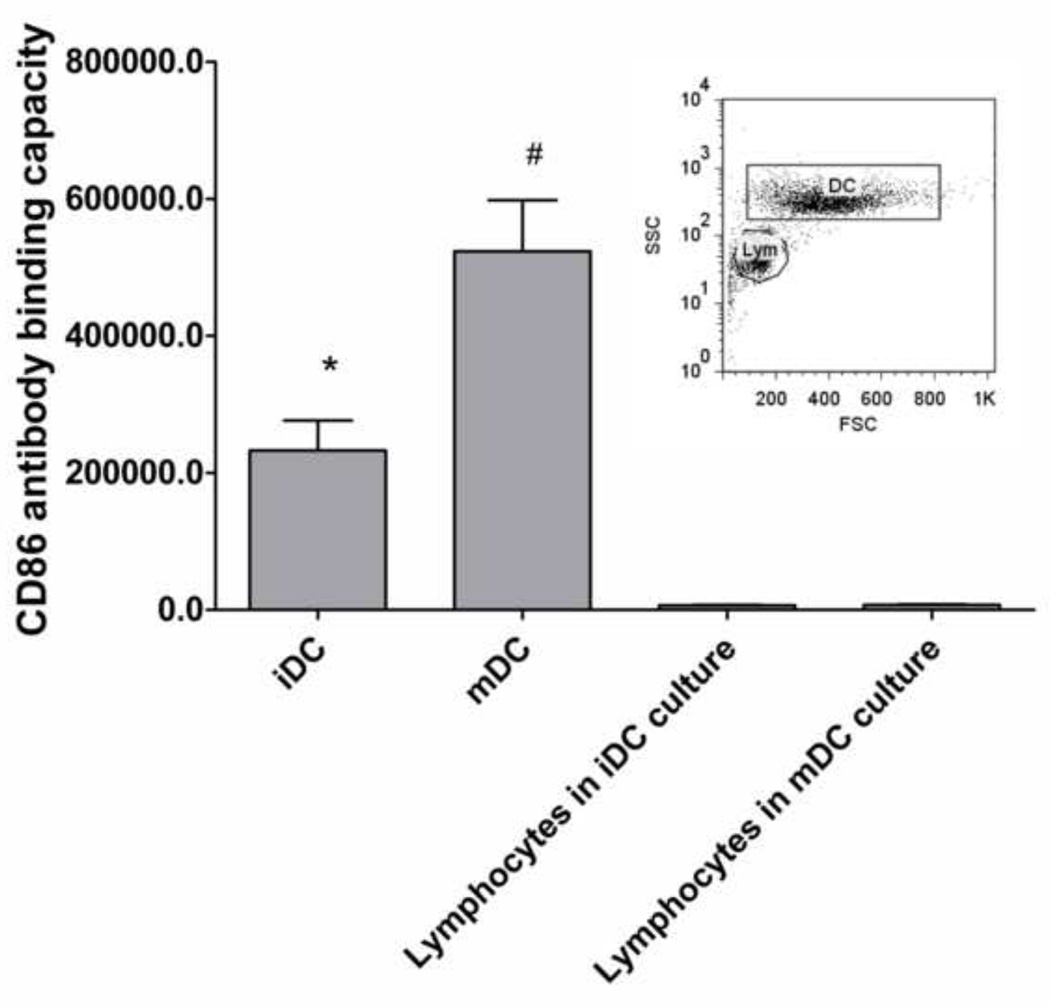
Figure 4.
CD86 expression on DCs and lymphocytes in the culture system. The antibody binding capacity of CD86 on DCs and B cells was measured by comparing the gMFIs of CD86 expression to a standard curve created by beads that bound known numbers of antibodies using the BD FACSDiva software with mean ± SEM, n=6 donors. The inset shows the gating of DCs and lymphocytes (Lym) based on the forward (FSC) and side scatters (SSC) of the two distinct cell populations for which CD86 expression levels were determined. *: p<0.05, lower than mDCs and higher than lymphocytes; #: p<0.05, higher than iDCs and lymphocytes.

