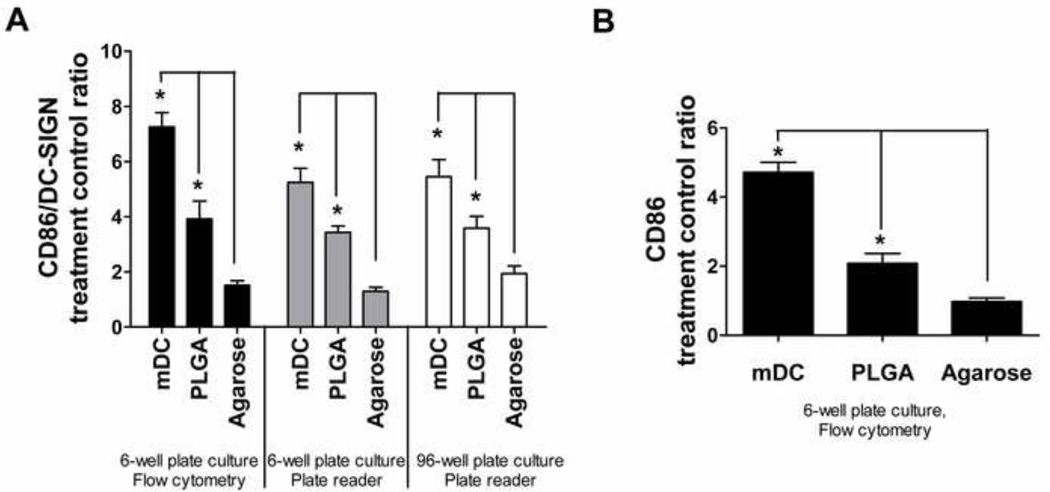
Figure 6.
Validation of the HTP methodology for assessing DC responses to biomaterials. A) Treatment/control ratios of ‘maturation factor’ (defined as CD86/DC-SIGN) for DCs treated with biomaterials or controls in the 6-well format and analyzed by flow cytometry (set of black bars), in the 6-well format and analyzed by fluorescent plate reader (set of grey bars), and in the 96-well format and analyzed by fluorescent plate reader (set of white bars). B) Treatment/control ratios of CD86 expression for DCs treated and analyzed using the conventional format of 6-well plates and flow cytometry for DCs treated with biomaterials or controls. Mean ± SEM; n=8 (6 donors). *: p<0.05, statistically different from iDCs and higher than iDCs. Brackets: p<0.05, statistically different between two biomaterial treatments or between biomaterial treatment and mDCs.

