Figure 3.
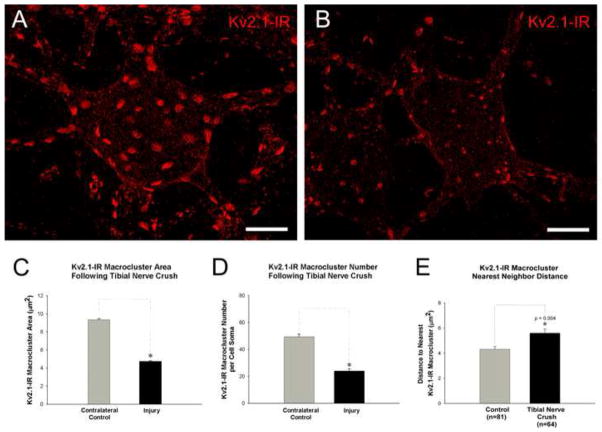
Kv2.1-IR macrocluster areas decrease on soma of medial and lateral gastrocnemius α-motoneurons following tibial nerve crush injury. To eliminate image variability resulting from artifacts or inconsistencies in tissue processing cells shown in panels A and B are from the same tissue section and imaged with fixed parameters. However, due to observed contralateral effects (see section 2.5) the illustrated data potentially underestimates the ‘absolute’ degree of change in cluster size that occurs in an injured neuron.(A) Micrograph of a confocal stack (32 × 1μ z-steps) of a contralateral motoneuron showing representative Kv2.1-IR clustering. Scale bar is 20 μm. (B) Micrograph of a confocal stack (32 × 1μ z-steps) of an 8 days post tibial nerve crushed motoneuron showing representative Kv2.1-IR clustering with reduced areas compared to the spared motoneuron. Scale bar is 20 μm. (C) Quantitative analysis of reduced Kv2.1-IR soma macrocluster areas on lumbar α-motoneurons 8 days following tibial nerve crush. (D) Quantitative analysis of reduced numbers of Kv2.1-IR soma macroclusters on lumbar α-motoneurons 8 days following tibial nerve crush. (E) Kv2.1 macrocluster nearest neighbor distance increases following 8 days post tibial nerve crush. In panels C, D, &E significance (p<0.05) is indicated with asterisk and determined with Pairwise T-Test and data is presented as mean ± SEM.

