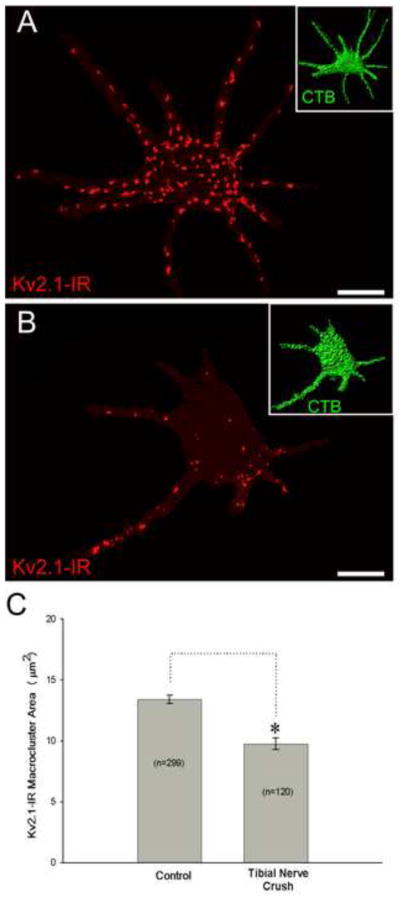
Figure 4.

Kv2.1-IR Macrocluster areas decrease on proximal dendrites of medial and lateral gastrocnemius α-motoneurons following tibial nerve crush. Both cells shown in these panels are from the same spinal cord tissue slice and are scaled equally. Scale bar is 30 μm. Inserts in the top right of panel A and B shows the CTB retrograde fills from gastrocnemius muscle that was used to reconstruct the cell somas and proximal dendrites. (A) Micrograph showing representative 3-D reconstruction, from confocal microscopy image stacks (57 × 0.5 μm z-steps), of a contralateral motoneuron. (B) Micrograph showing representative 3-D reconstruction, from confocal microscopy image stacks (41 × 0.5 μm z-steps), of a motoneuron 8 days following nerve crush. (C) Quantitative data from 10 control and 10 injured motoneurons showing Kv2.1-IR macrocluster areas significantly decrease on proximal dendrites following both 8 days post tibial nerve crush. Data is presented as mean ± SEM. Significance is set to p<0.05.
