Figure 5.
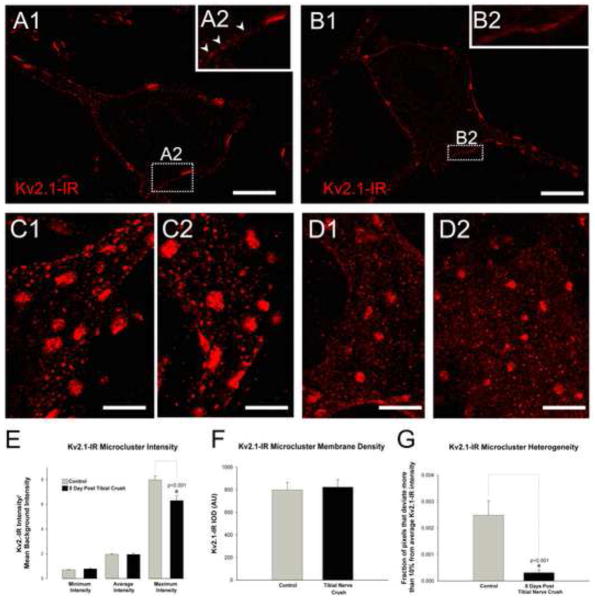
Kv2.1 microcluster immunoreactivity becomes more diffuse on soma of medial and lateral gastrocnemius α-motoneurons following tibial nerve crush injury. To eliminate image variability resulting from artifacts or inconsistencies in tissue processing cells shown in panels A and B are single optical confocal sections from the same tissue section and imaged with fixed parameters. However, due to observed contralateral effects (see section 2.5) the illustrated data potentially underestimates the ‘absolute’ degree of change in cluster size that occurs in an injured neuron. Both panels A and B are single optical confocal sections through the center of the cell from the same tissue section and imaged with fixed parameters. Full confocal stacks of these two cells are shown in figure 3. (A1) Micrograph of single optical section of a contralateral motoneuron showing representative Kv2.1-IR clustering. (A2) Inset is zoomed region of the membrane, indicated by dotted box, with arrowheads pointing to distinct Kv2.-IR microcluster punctae in the membrane. Scale bar is 20 μm. (B1) Micrograph of single optical section of an 8 days post tibial nerve crushed motoneuron showing representative diffuse Kv2.1 microcluster immunoreactivity compared to the spared motoneuron. (B2) Inset is zoomed region of the membrane, indicated by dotted box. Note diffuse Kv2.1 microcluster immunoreactivity in the membrane compared to distinct punctae shown by arrowheads in A2. Scale bar is 20 μm. (C&D) Micrographs of small confocal stacks (10 × 1.0 μm Z-steps) of small patches of en face membrane regions. The distinct microcluster punctae in the spared motoneurons (panels C) appear more diffuse 8 days after tibial nerve crush (panels D). Scale bars are 10 μm. (E) Quantitative analysis of Kv2.1-IR microcluster intensity of lumbar α-motoneuron somas of spared and 8 day post tibial nerve crush. (F) Quantitative analysis of Kv2.1 microcluster integrated optical density of immunoreactive pixels on lumbar α-motoneuron somas of spared and 8-day post tibial nerve crush. (G) Quantitative analysis of Kv2.1-IR microcluster heterogeneity, the fraction of pixels that deviate more than 10% from the average intensity, on lumbar α-motoneuron somas of control and 8 day post crush. Data is presented as mean ± SEM. Significance (p<0.05) as indicated with asterisk was determined with t-test.

