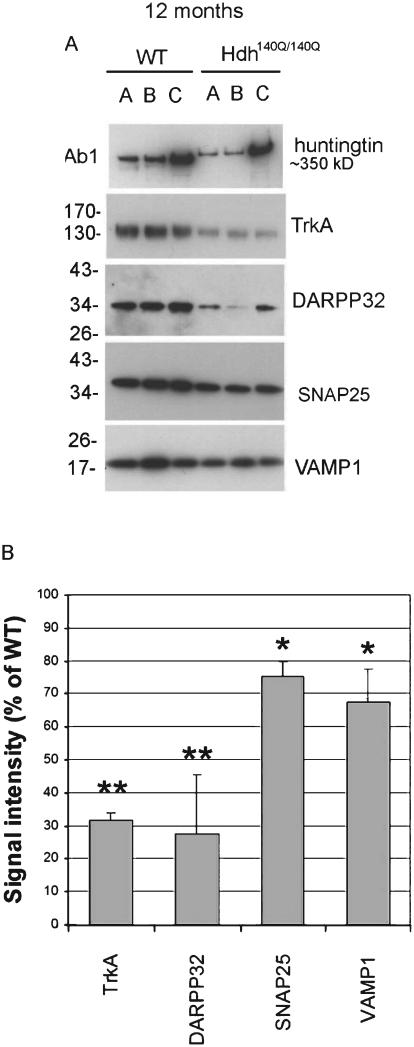
Fig. 3.
Biochemical assay and quantitative analysis of proteins reduced in cortical synaptosomes of 12 month old WT and Hdh140Q/140Q mice. A. Western blots show the results for proteins that were changed in Hdh140Q/140Q synaptosomes compared to WT. B. Bar graphs show Mean percent±SD signal intensity in Hdh140Q/140Q synaptosomes compared to WT mice. All proteins indicated were significantly different from WT (Student’s t-Test, N = 4 WT, 4 Hdh140Q/140Q evels of proteins show, *p < 0.05 **p < 0.005).

