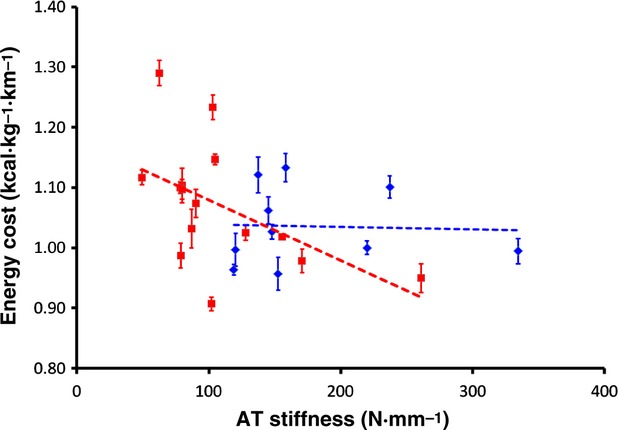
Figure 3.

The relationship between Achilles tendon (AT) stiffness and the energy cost of running for men and women. Open and closed dots represent each man and woman subject, respectively. Erun is represented as mean ± SD for all measured speeds. AT stiffness is shown as the stiffness representing the slope from 50 to 100% MVC of the force‐elongation curve for each subject. Solid and dashed lines represent the linear regression for woman and man subjects, respectively.
