
Figure 7.
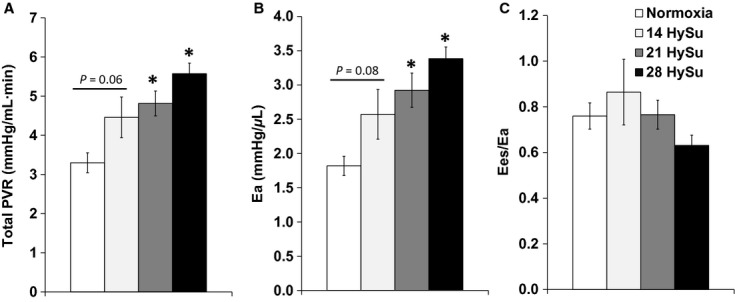
Changes in RV afterload parameters (total PVR and Ea) and ventricular–vascular coupling efficiency (Ees /Ea) during the progression of PAH. N = 8–9 per group. *P < 0.05 versus normoxia.
Official websites use .gov
A
.gov website belongs to an official
government organization in the United States.
Secure .gov websites use HTTPS
A lock (
) or https:// means you've safely
connected to the .gov website. Share sensitive
information only on official, secure websites.
Changes in RV afterload parameters (total PVR and Ea) and ventricular–vascular coupling efficiency (Ees /Ea) during the progression of PAH. N = 8–9 per group. *P < 0.05 versus normoxia.