Figure 8.

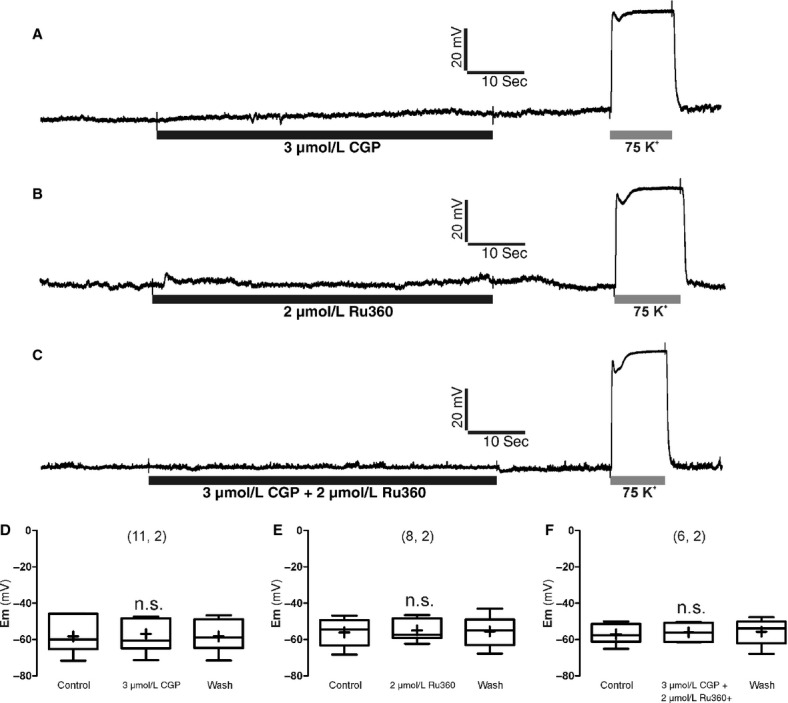
Effects of combined Ru360 (2 μmol/L) and CGP37157 (3 μmol/L) on the resting membrane potential (Em) monitored in current‐clamped BBC. (A–C) are records taken from three BCCs exposed to the compounds at the concentrations and time periods indicated at the bottom horizontal bars below each trace. K+ (75 mmol/L, low Na+) was given at the end of each experiment as a positive control of cell depolarization. (D–F) are the summary of pooled data from the number of cells and cultures shown in parentheses on top of each set of box‐and‐whiskers plots (the line inside the box depicts median values, the cross inside the box represent mean values, the size of the box is given by the distance between the 25th and the 75th percentiles; upper “whisker” reach the 90th percentile and lower “whisker” the percentile 10th). Em, resting membrane potential before, during, and after washout of the compounds. n.s., nonsignificant statistical difference compared with control.
