
Figure 1.
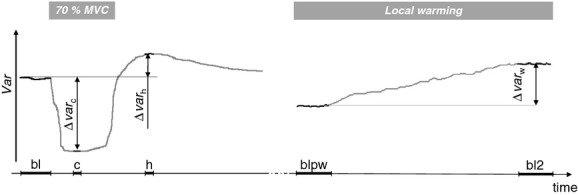
Illustration of the time intervals and of the notation used for the measurements (see text). The drawing represents the hypothetical response of a generic variable Var to contraction (left) and local warming (right).
Official websites use .gov
A
.gov website belongs to an official
government organization in the United States.
Secure .gov websites use HTTPS
A lock (
) or https:// means you've safely
connected to the .gov website. Share sensitive
information only on official, secure websites.
Illustration of the time intervals and of the notation used for the measurements (see text). The drawing represents the hypothetical response of a generic variable Var to contraction (left) and local warming (right).