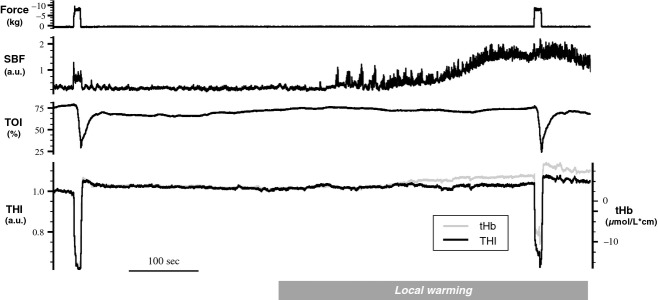
Figure 2.

Original tracings from a representative subject. From top to bottom: force, skin blood flow (SBF), tissue oxygenation index (TOI), and blood volume indices (THI in black and tHb in gray). The subject performs two contractions at 70% of MVC, as indicated by the force signal, before and after a stable level of cutaneous hyperemia is reached, following exposure to warm air flow (local warming indicated at the bottom). Amplifications of THI and tHb was adjusted in order to have overlapping responses to the first muscle contraction. Note how the tHb signal is affected by changes in SBF, as compared to THI.
