
Figure 4.
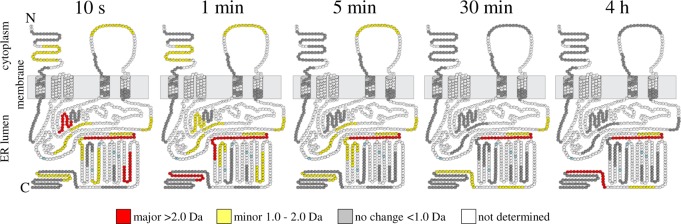
Deuterium difference diagrams illustrating GGCX topology images at consecutive HX labeling intervals from 10 s to 4 h. The difference in deuterium incorporation for each GGCX peptide was calculated at individual labeling time points by subtracting the deuterium level for the pCon-bound GGCX from the deuterium level of unbound GGCX. The change in deuterium incorporation is plotted on the predicted topology map of GGCX where a major (>2.0 Da), minor (1.0–2.0 Da), and no distinguishable change (<1.0 Da) corresponds to the colors red, yellow, and gray, respectively. Residues in white were not observed with confidence in duplicate biological and sample preparations for both experimental conditions (with or without propeptide). Neighboring and overlapping peptides were used for deuterium uptake pattern validation (see also Supplemental Figure S2, Supporting Information). Glycosylation sites are highlighted in light blue.