
Figure 5.
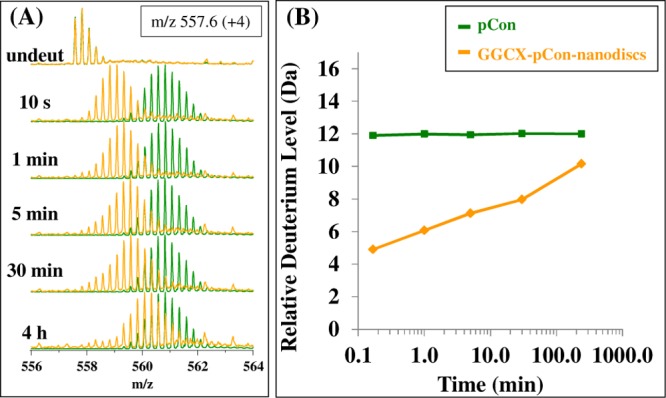
Mass spectra (A) during the HX time course for the pCon substrate (green) and GGCX-pCon-nanodiscs (orange). At each time point interval from 10 s to 4 h, the isotopic centroided mass of the peptide distribution was determined to create the deuterium uptake plot (B). The y-axis maximum represents the total possible exchangeable backbone amide hydrogens in the consensus propeptide sequence.