
Figure 2.
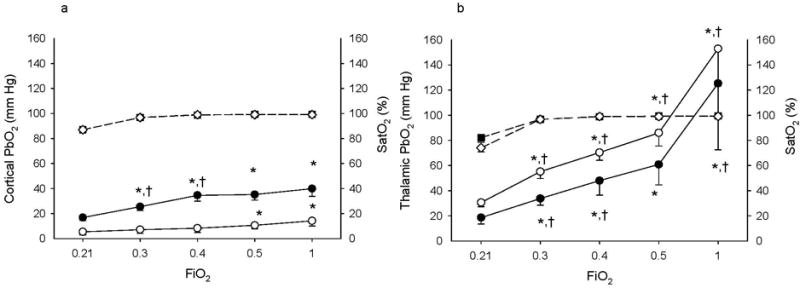
Cortical (a) and thalamic (b) PbO2 and Sat O2 response to increase in FiO2 from 0.21 to 0.3, 0.4, 0.5, and 1.0 after 9 and 12 min asphyxia. Black circles represent PbO2 for the 9 min CA group, white circles represent PbO2 for the 12 min CA group, black squares represent SatO2 for the 9 min CA group, and white diamonds represent SatO2 for the 12 min CA group. n= 6/group/region. (*p<0.05 vs. FiO2=0.21, †p<0.05 vs. previous FiO2).