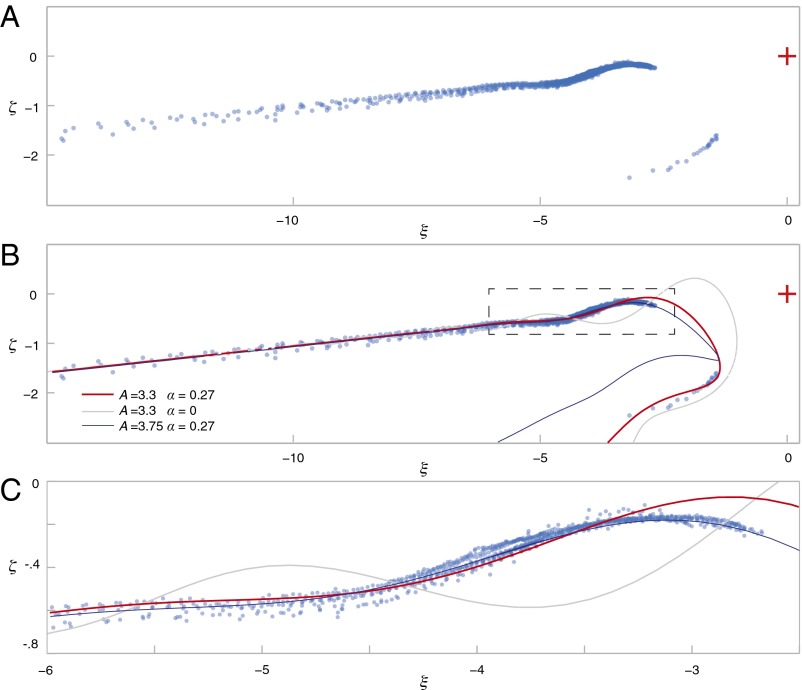
Fig. 5.
The overlap of the curves described by similarity solutions of LIA and Biot–Savart models (colored curves) to the experimental data in similarity coordinates (blue circles). We report just the Biot–Savart (B-S) curves as the LIA curves are almost indistinguishable. We show two different curves that are both in qualitative agreement with the observation: the red curve for the lower-bound value A = 3.3, and the blue curve for the upper-bound value A = 3.75, obtained from this particular fit to maximize the overlap of the Biot–Savart curves, respectively, with both the lower and upper branch and just the upper branch of the collapsed data. These values of A correspond, respectively, to intervortex angles of 40° and 29°. In both cases the angles that set the 3D orientation are free parameters selected by hand. We also show a LIA curve without any damping (thin gray line), to demonstrate the necessity of including the mutual friction. (A) shows most of the collapsed data, whereas (C) shows in detail the area close to the first peak of the wave marked by the dashed region in (B). The red cross represents the reconnection estimated origin.

