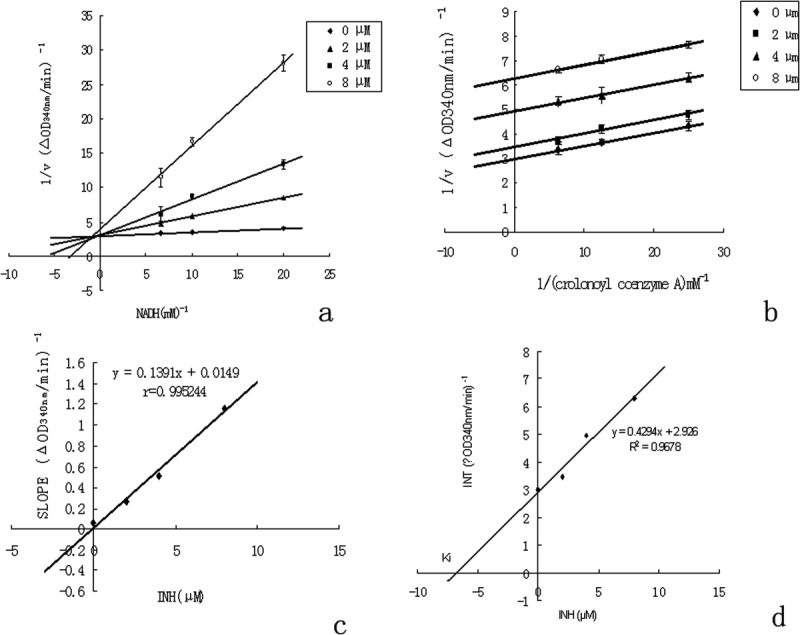
Figure 5.

Inhibitory mechanism of ClFabI by INH. (a) Lineweaver–Burk plot showing competitive inhibition of FabI binding to NADH by INH. The enzyme was incubated in the presence of different concentrations of INH and NADH at a fixed concentration of crotonoyl-CoA (40 μM). The concentrations of INH were 0 μM (diamond), 2 μM (triangle), 4 μM (square), and 8 μM (circle). (b) Lineweaver–Burk plot showing uncompetitive inhibition of FabI binding to crotonoyl-CoA by INH. The enzyme was incubated in the presence of different concentrations of INH and crotonoyl-CoA at a fixed concentration of NADH (100 μM). The concentrations of INH were 0 μM (diamond), 2 μM (triangle), 4 μM (square), and 8 μM (circle). (c) The slope values of the lines from Figure 5(a) are plotted versus INH concentration, the secondary plot of Ki. An inhibitor constant value of 0.11 μM for NADH was determined. (d) The intercept values of the lines from Figure 5(b) are plotted versus INH concentration. A Ki value of 6.8 μM for crotonoyl-CoA was determined.
