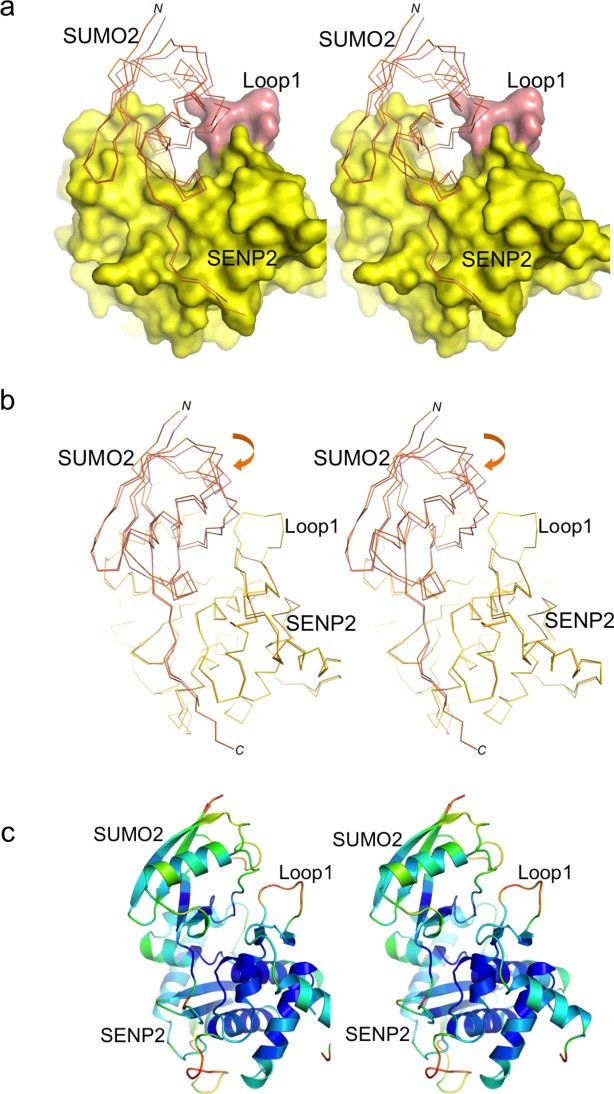
Figure 2.

Structural comparison of SUMO2 in complex to SENP2-Loop1 and SENP2. A: Stereo representation of the complex between SENP2-Loop1, shown in as surface representation, and SUMO2, shown as a thin line. SUMO2 is shown superimposed with SUMO2 from the complex with SENP2 (PDB code 2IO0). Loop1 insertion is shown in orange. B: Stereo backbone representation of the superposition between SENP2-Loop1 (yellow) and SENP2 (orange, PDB code 2IO0) in complex with SUMO2. C: B-factor color-based stereo cartoon representation of the SENP2-Loop1:SUMO2 complex.
