
Figure 1.
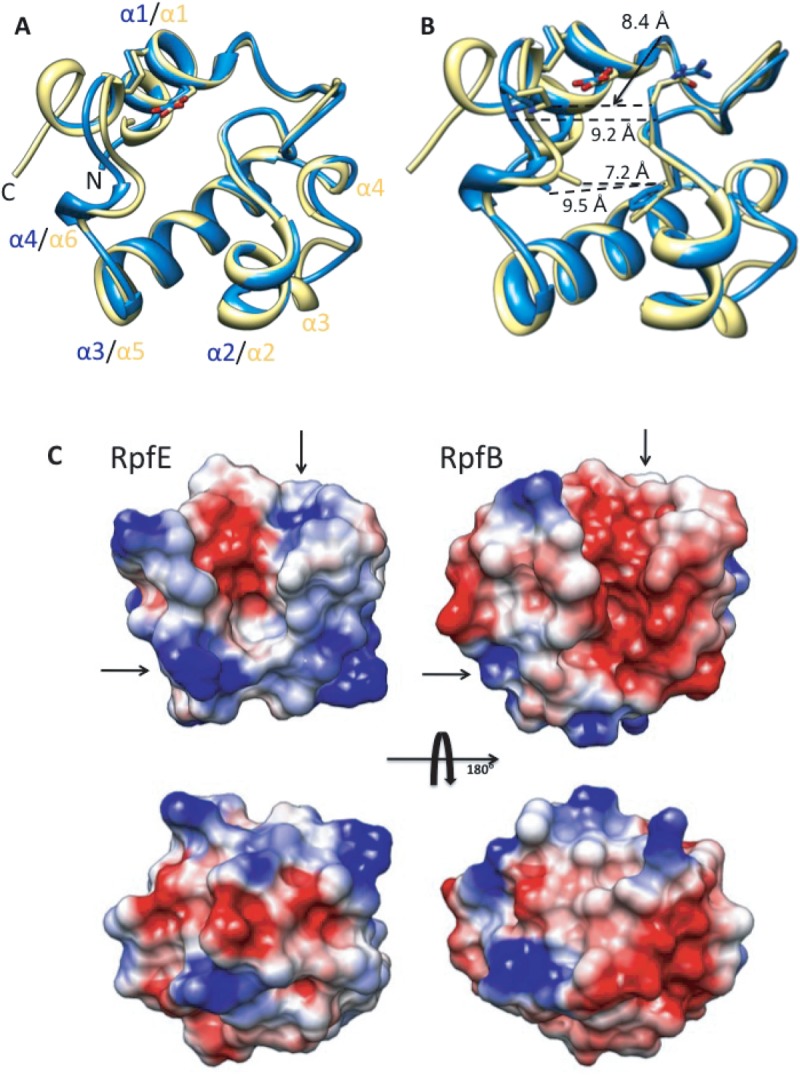
A: Ribbon representation of superimposed RpfE (blue) and RpfB (yellow) catalytic domain. The conserved, catalytic glutamate is shown in stick representation. B: RpfE and RpfB catalytic-cleft, Cα distance differences. C: Electrostatic potential surfaces (blue, > +5 kT and red, < −5 kT) of RpfE and RpfB calculated using the program Swiss-PdbViewer. RpfE shows positive potential around the predicted peptide-binding surfaces (arrows), while RpfB presents predicted peptide-binding surfaces (arrows) that are calculated to be negatively charged at neutral pH.