
Figure 3.
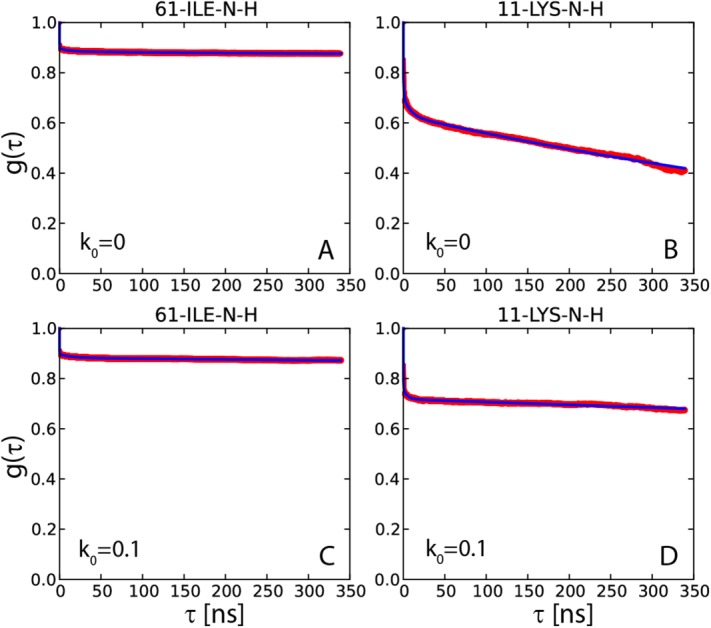
15N-1HN dipolar correlation functions from two 400-ns-long simulations of crystalline ubiquitin: (a,b) 4U, k0 = 0 uMD simulation and (c,d) 4U, k0 = 0.1 erMD simulation. Red profiles represent the numerically calculated MD correlation functions  (after averaging over 24 ubiquitin molecules found in 4U periodic-boundary box). Blue curves are the result of 4-exponential fitting
  , as conducted over the interval from 0 to 85% of the total simulation length. The residue I61 shows typical convergence behavior as observed in the uMD simulation (its convergence parameter Δ corresponds to the median value in the list comprising the simulated data for residues 1–72). The residue K11 shows the worst convergence behavior in the uMD simulation (highest Δ value). All of the obtained correlation functions are remarkably smooth, which reflects good statistical properties of the simulations containing 24 ubiquitin molecules.