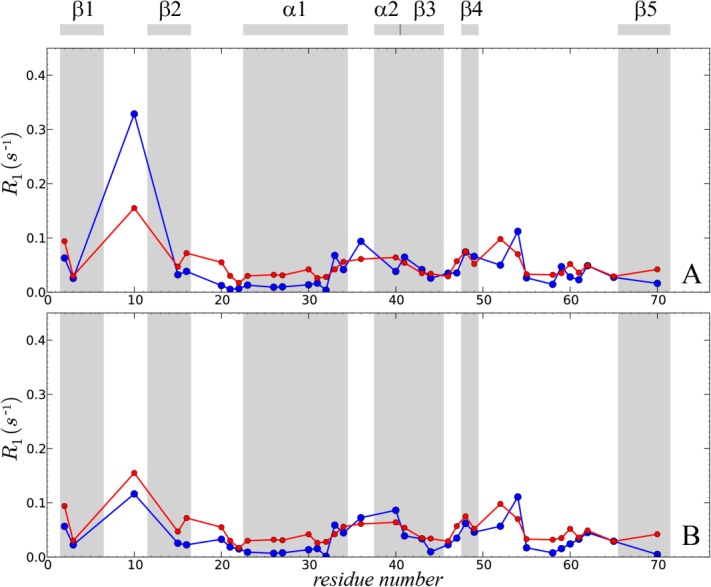
Figure 6.

Comparison of the experimental and predicted 15N R1 relaxation rates in crystalline ubiquitin at static magnetic field strength 11.74 T. Experimental data (red symbols) are as reported by Schanda et al.23 The simulated data (blue symbols) are from: (A) the uMD simulation, k0 = 0, and (B) the erMD simulation, k0 = 0.1 kcal mol−1 Å−2. Each MD trajectory involves a block of four crystal unit cells (4U, 24 ubiquitin molecules) and has a total duration of 400 ns.
