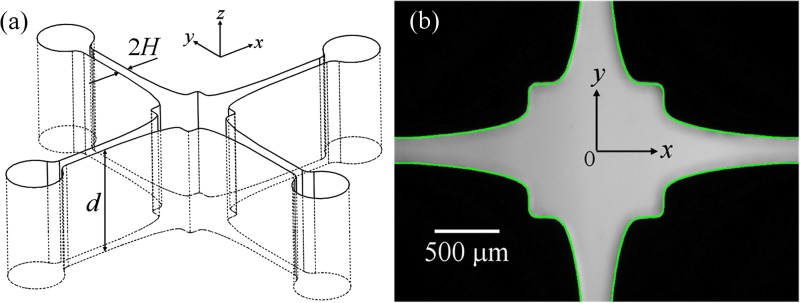
Figure 4.
(a) 3D view of the OSCER geometry showing the upstream and downstream characteristic channel dimension H and the uniform depth d. (b) Light micrograph of the actual OSCER geometry. The inflow is along the y- and the outflow along the x-direction. At the center of the geometry there is a stagnation point, here marked as the origin of coordinates. The superimposed green line represents the prescribed profile determined from numerical optimization.

