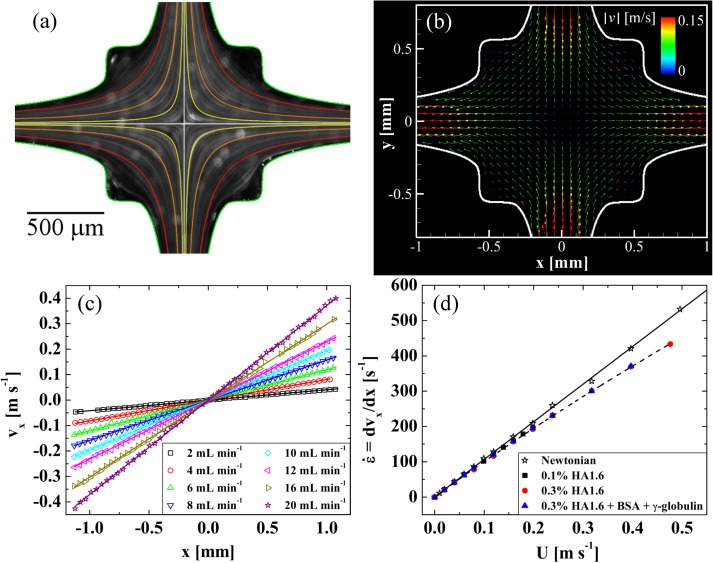
Figure 5.
(a) Streak imaging showing the nature of the flow field in the OSCER with a Newtonian fluid at U = 0.01 , with superimposed colored hyperbolae for comparison. The superimposed white lines indicate the symmetry axes of the geometry, which coincide at the stagnation point. Flow enters through the top and bottom channels and exits through the left- and right-hand channels. (b) Experimental flow velocity vector field, measured using μ-PIV, for an analogue synovial fluid at U = 0.2 (Re = 2.8, Wi = 3.1). (c) Outflow velocity vx (x) measured along y = 0 for the analogue synovial fluid. At any given flow rate vx varies linearly with x and the slope of the straight line provides the elongation rate along the exit channel centerline. (d) Elongation rate as a function of superficial flow velocity for HA1.6 solutions in the OSCER, compared with the result for a Newtonian fluid.

