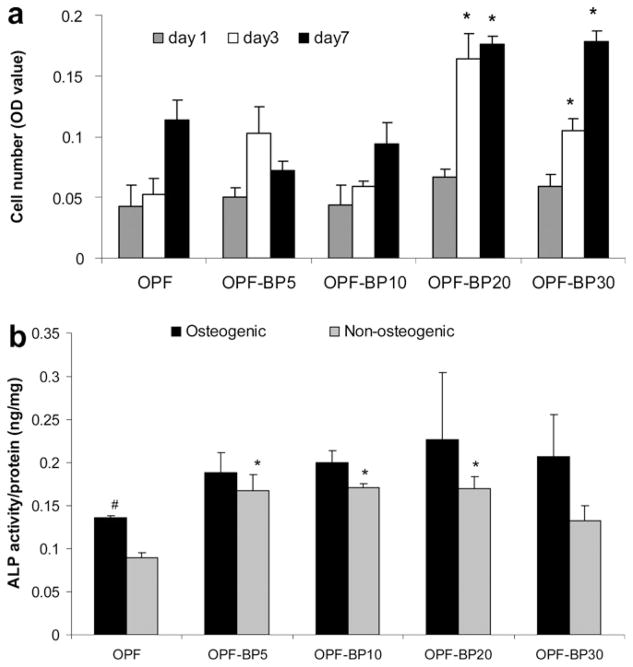
Fig. 10.
(a) Proliferation of MSCs on OPF hydrogels with varying concentrations of BP in their formulation on days 1, 3 and 7. Cell number was determined using the MTS Cell Proliferation Assay by measuring the optical density (OD) at 490 nm. *P < 0.05 significantly different as compared to unmodified OPF hydrogel at the same time point. (b) ALP activity of MSCs on OPF hydrogels with different concentrations of BP in osteogenic and non-ostegenic media after 7 days in culture. *P < 0.05 significantly different as compared to unmodified OPF hydrogel in the same media, #P < 0.05 significantly higher in osteogenic media. Values represent mean ± standard error (n = 3).

