Figure 2.

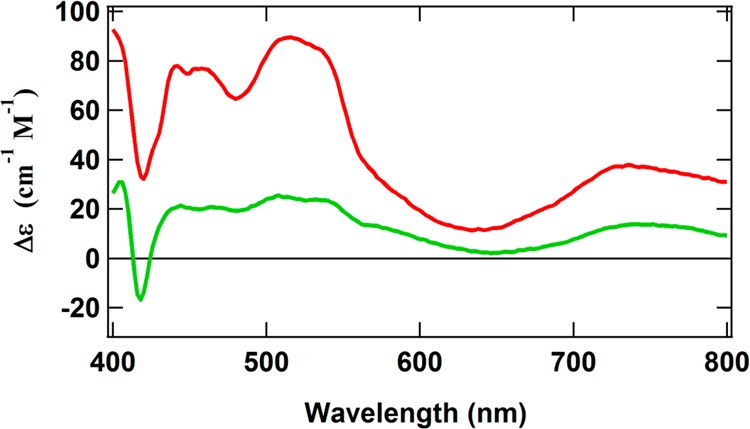
MCD spectra of Ti(III) citrate-reduced ΔnifH NifDK (red) and Ti(III) citrate-reduced NifH (green). Both spectra were recorded at 1.6 K and 6 T. The sharp inflections around 420 nm in both spectra are likely due to a minor heme impurity.

MCD spectra of Ti(III) citrate-reduced ΔnifH NifDK (red) and Ti(III) citrate-reduced NifH (green). Both spectra were recorded at 1.6 K and 6 T. The sharp inflections around 420 nm in both spectra are likely due to a minor heme impurity.