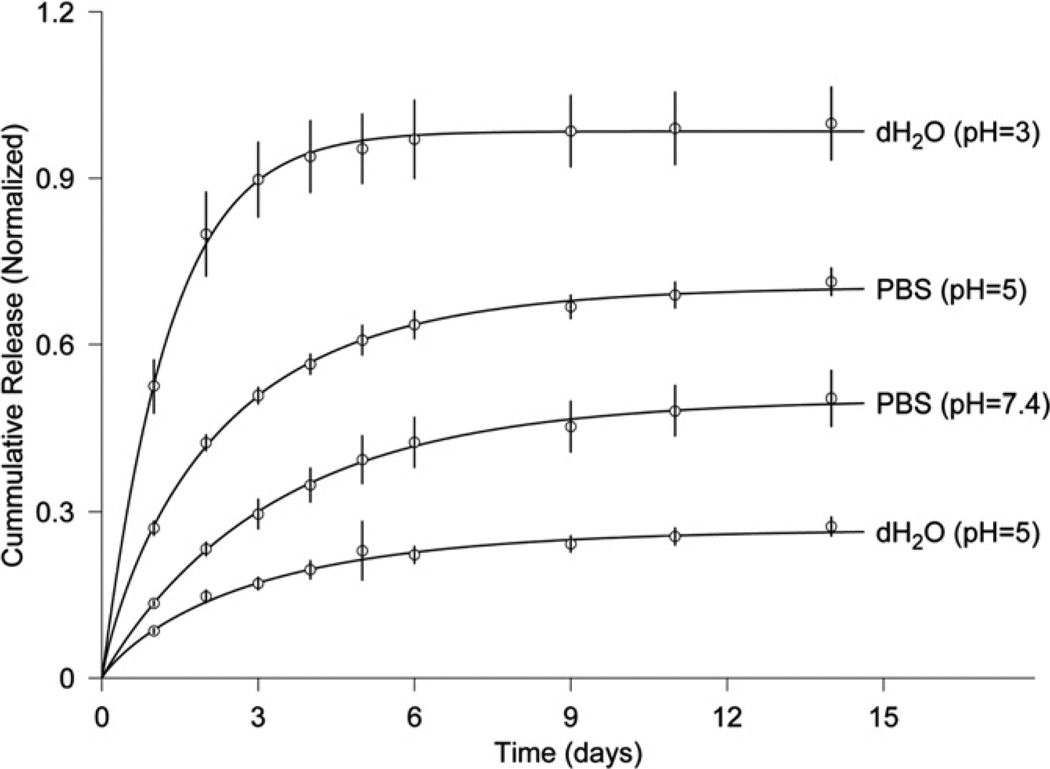
Fig. 8.
Release of DOX from HG-SMA200 in solutions of varying pH. The amounts of DOX released from microgels are normalized to the initial amounts of loaded DOX (symbol ○). The solid curves are provided by the non-linear least-squares fitting of data by our model (Eq. (1)).

