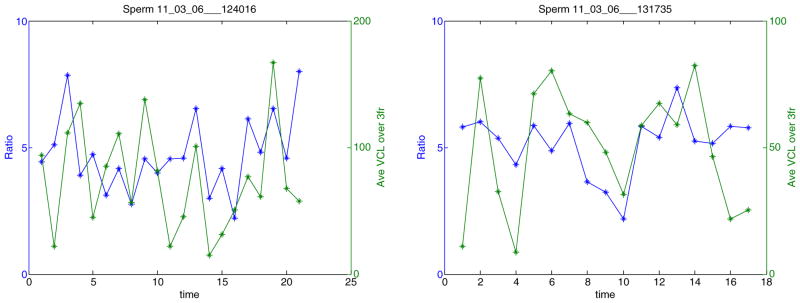
Fig. 8.

Swimming speed (VCL) and fluorescent ratio fluctuations of each individual sperm. The left y-axis is the ratio value. The right y-axis is the VCL value averaged over three frames around the frame a ratio image is taken. Both are plotted against time (seconds)
