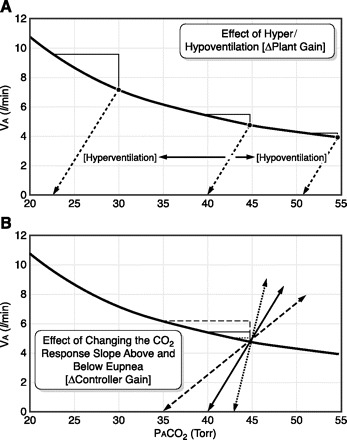
Fig. 7.

Diagrammatic representation of the relationship between alveolar ventilation (VA) and alveolar Pco2 (PaCO2) at a fixed resting CO2 production (of 250 ml/min); PaCO2 = V̇co2/ V̇A × K. The schematic figure shows how changing plant gain (A, top) or controller gain (B, bottom) will influence the “CO2 reserve” or ΔPaCO2 between eupnea and apnea. A: changing the background drive to breathe without changing the slope of the ΔVA vs. ΔPaCO2 relationship above or below eupnea. For example, background hyperventilation raises VA and lowers PaCO2 along the isometabolic hyperbola. This means that a greater transient increase in VA and reduction in PaCO2 is required to reach the apneic threshold than it would be under control, normocapnic conditions. The reverse is true for conditions which reduce the background drive to breathe and cause hypoventilation. B: at any given level of background PaCO2, changing the slope (or responsiveness) of the ΔVA-ΔPaCO2 relationship below eupnea would alter the CO2 reserve or the amount of reduction in PaCO2 required to cause apnea. Changing the slope of the ventilatory response to CO2 above eupnea would alter the susceptibility for transient ventilatory overshoots. See text for a discussion of conditions which change controller and plant gain and therefore the susceptibility to transient ventilatory overshoots to apnea and ventilatory instability in sleep. [Adapted from Dempsey (127).]
