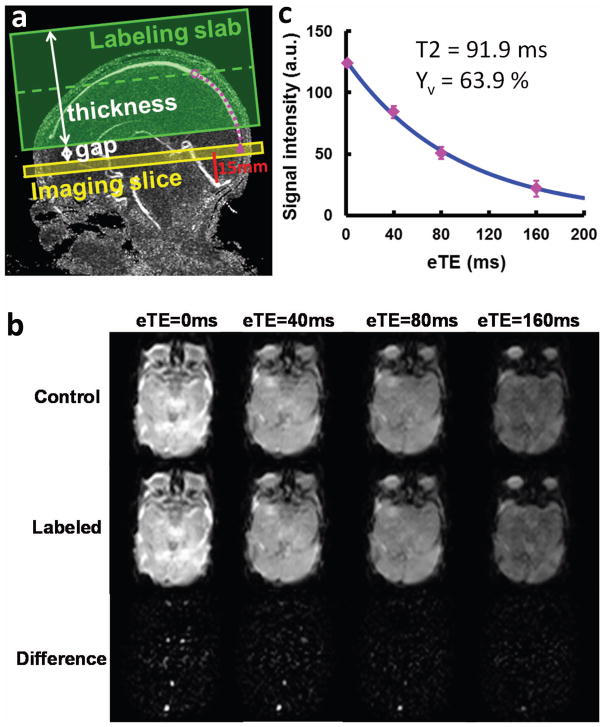
Figure 2.
Measurement of venous oxygenation (Yv) using T2-Relaxation-Under-Spin-Tagging (TRUST) MRI. (a) Imaging slice (yellow) and labeling slab (green) of the TRUST MRI scan illustrated on the velocity map of superior sagittal sinus (SSS). The imaging slice was positioned to be parallel to anterior-commissure posterior-commissure line with a distance of 15 mm from the sinus confluence. The labeling thickness and gap were determined by an automatic algorithm based on identifying the location of the blood (open purple circle) at 1022 ms prior to reaching the imaging slice (filled purple circle). (b) MR images under control (top row) and labeled (middle row) conditions. Each type of image is acquired at four different T2-weightings, denoted by the effective echo time (eTE). The bottom row is the difference image, i.e. Control-Labeled. (c) Monoexponential fitting of the signal intensity in SSS as a function of eTE yields the CPMG T2 of the venous blood, which is then converted to Yv via a calibration plot. Error bar indicates standard error of the eTE measurements. The standard error of this Yv estimation was 3.3%.

