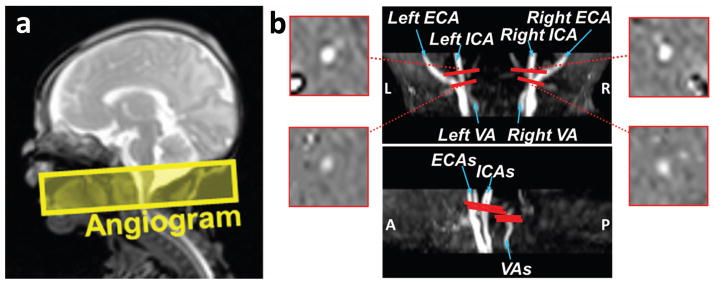
Figure 3.

Measurement of cerebral blood flow (CBF) using Phase-Contrast (PC) MRI. (a) Slice position of the 3D angiogram scan that was used to visualize the feeding arteries. (b) Results of the angiogram scan with slice positions of the PC MRI scans. Center: coronal and sagittal maximum-intensity-projection (MIP) views of the angiogram shown on the scanner (See Supplementary Figure S1 for the post-processed MIP images of ICAs and VAs separately). Four PC MRI scans (red bars) are positioned perpendicular to the respective feeding arteries based on the MIP image of the angiogram. The corresponding phase images of the target arteries from the PC MRI scans are shown on the two sides.
