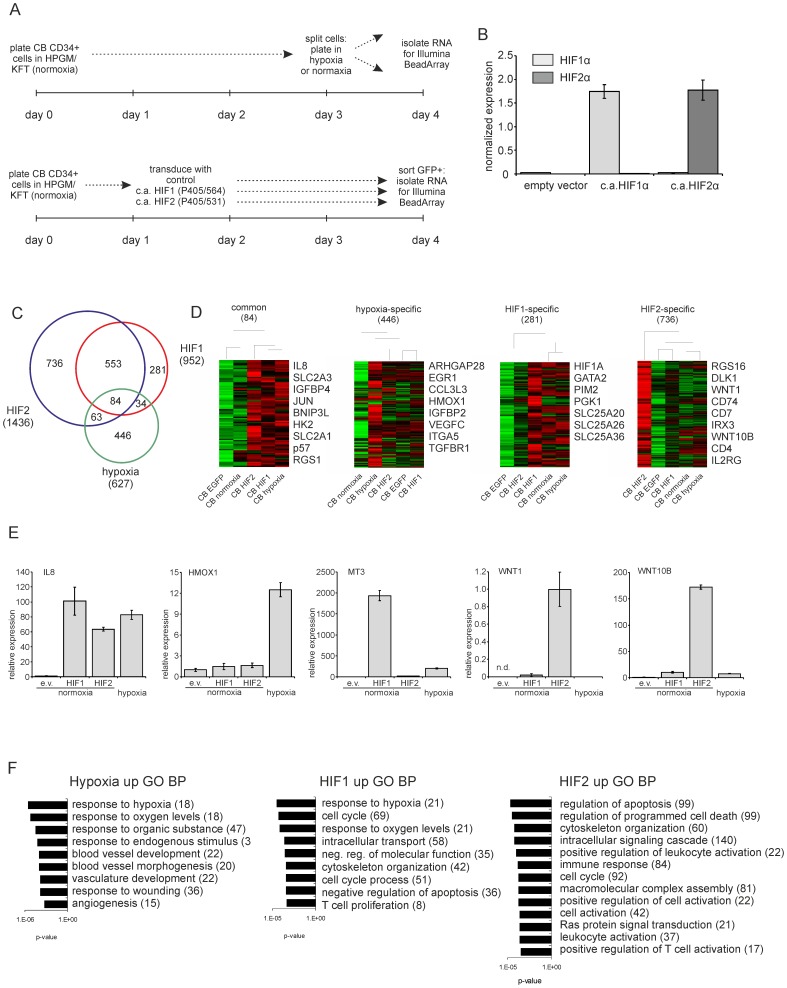
Figure 1. Identification of hypoxia, HIF1 and HIF2 target genes in human CB CD34+ cells.
A. Schematic representation of performed experiments. B. Q-RT-PCR to verify HIF1/2 expression in the mRNA preparations used for transcriptome analysis. C. VENN diagram displays genes upregulated by HIF1, HIF2 or hypoxia. Supervised cluster analysis is shown, including a number of selected upregulated genes and associated GO terms. D. CB CD34+ cells were transduced with the indicated overexpression vectors at normoxia and/or cultured under hypoxic conditions for 24 hours. Q-RT-PCR was performed for the indicated targets. (e.v. = empty vector, n.d. = not detectable). E. Gene ontology analysis on genes upregulated by hypoxia, HIF1 or HIF2. All GO terms with an FDR<1 are shown.

