
Figure 2.
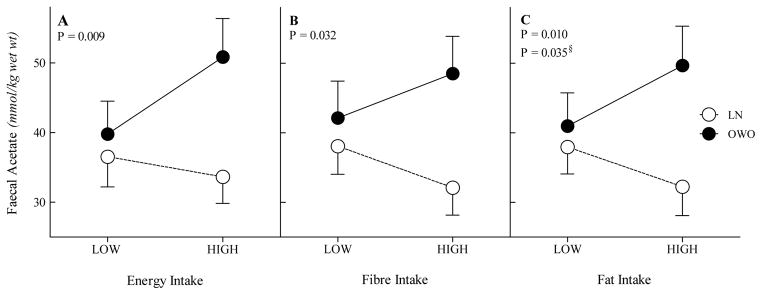
Group and dietary components interactions with faecal acetate concentration; Group by Energy intake interaction with faecal acetate concentration (A), Group by fibre intake with faecal acetate concentration (B), Group by fat intake interaction with faecal acetate concentration (C). Low, visit with lower intake; High, visit with higher intake. §adjusted for energy.