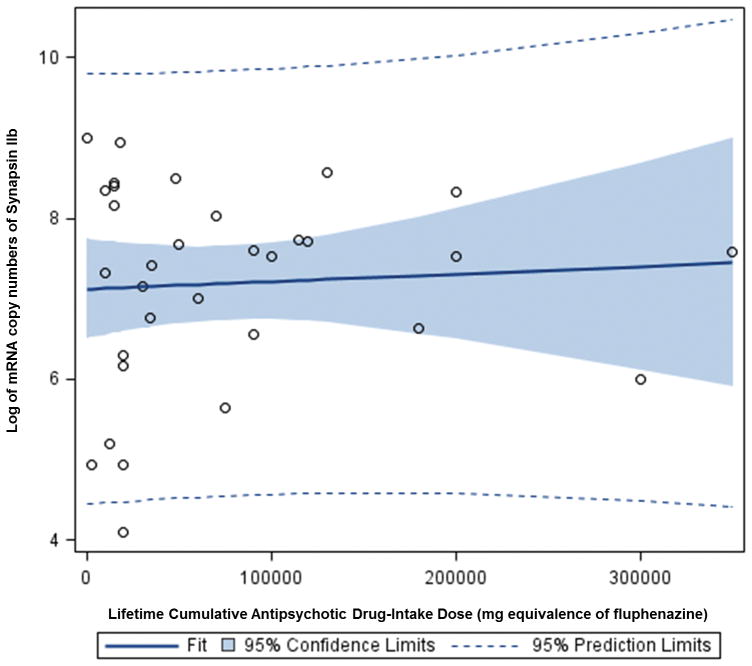
Figure 6.
Graph depicting a direct linear relationship between expression levels of synapsin IIb mRNA (expressed as copy numbers) and lifetime antipsychotic drug use (expressed as fluphenazine equivalents) in patients with schizophrenia. A solid line represents a fitted regression line, a dotted line represents the probability (0.95) that the “true” fitted line (in the population) falls between the bands, while the shaded region depicts the 95% confidence interval.

