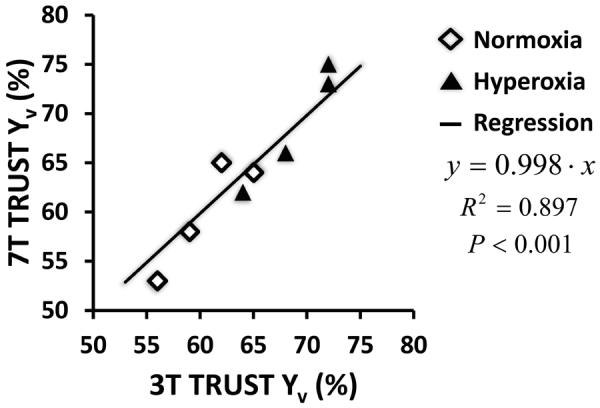
Figure 4.

A scatter plot of correlation between TRUST data at 7T and at 3T. The data were obtained from a group of four subjects. Each subject contributed two data points to the plot, one during normoxia (open diamond symbols) and the other duration hyperoxia (filled triangle symbols).
